Event Details
If a picture is worth a thousand words, is a visualisation worth a thousand data points? This one day symposium will bring together researchers and data lovers from a range of disciplines across the sciences and humanities to talk about the ways in which they practice the art and science of data visualisation. Rather than focusing on the research that generates the data, we are inviting presentations that focus specifically on the creation of data visualisations and the questions that they answer - and invite!
This is a fully catered, all-day event hosted by The Walter and Eliza Hall Institute of Medical Research.

The symposium will create an occasion on which data users from anywhere and everywhere on the research spectrum can share what’s in their data visualisation toolbox, exchange thoughts on effective visualisations, and go away inspired to move beyond bar charts and boxplots and to create compelling visualisations of their data.
You don't have to have an academic affiliation to join us. If your work or hobbies involve exploring and visualising data, we want to hear from you!
To register, please visit https://www.trybooking.com/RCOH
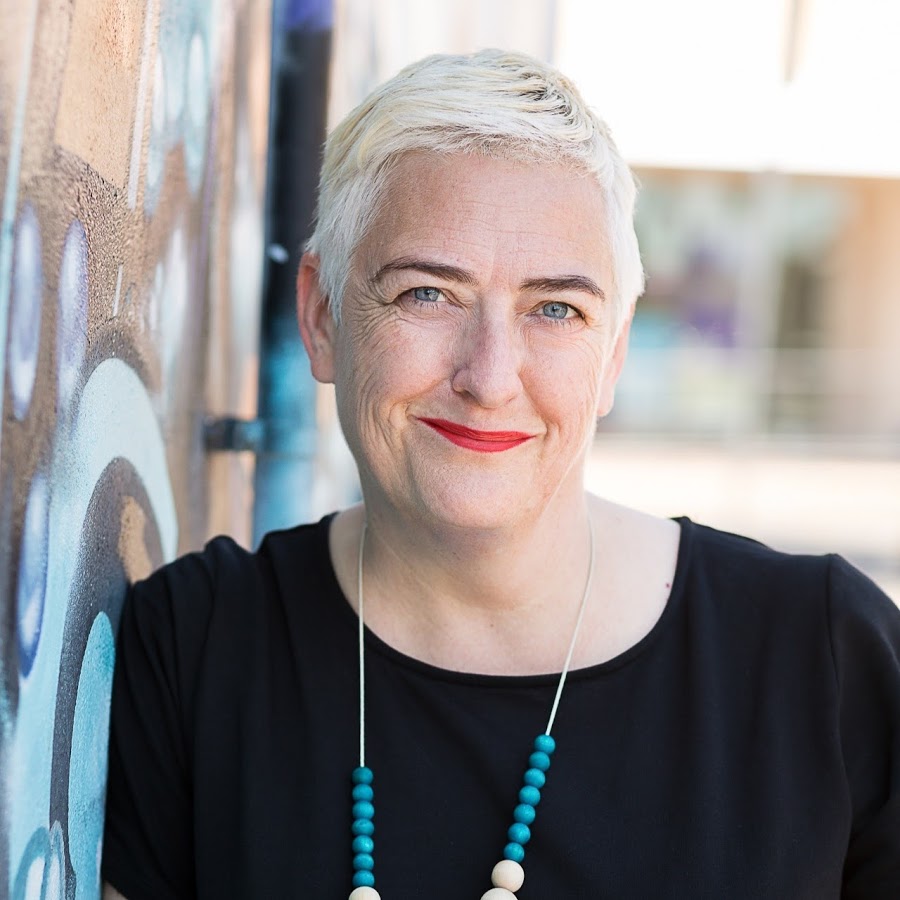
Keynote speaker: Professor Deb Verhoeven

Deb Verhoeven is Professor of Media and Communication in the School of Communication and Creative Arts, Deakin University, Vice Chancellor's Library Fellow and Director of the Humanities Networked Infrastructure (HuNI) Project. Amongst her many accolades she was named Australia's Most innovative Academic in 2013.
Professor Verhoeven is one of Australia's leading proponents of Digital Humanities research. Her work addresses the vast amounts of newly available 'cultural data' that has enabled unprecedented computational analysis in the humanities. This work has culminated in the Kinomatics Project, a multi-institutional, multi-disciplinary research effort based on collecting, exploring, analysing and representing data about the creative industries. In addition to scholarly publications and media appearances, she has focused on the development of national online research resources such as the Humanities Networked Infrastructure Project (HuNI); the Cinema and Audiences Research Project (CAARP) database; and The Ultimate Gig Guide (TUGG) an online archive of live music information. In 2013 Professor Verhoeven initiated the Research My World collaboration between Deakin University and the crowdfunding platform pozible.com to pilot the micro-financing of university research.
Call for Proposals
The Call for Proposals is now closed. Thank you to everyone who submitted an abstract!
Possible topics include:
- Data management decisions
- Choice of tool
- Visual impact and communication
- How final publication and sharing influence the design process
We encourage presentations that focus on the creation of single visualisation or series of visualisations or that have pushed the boundaries of what may be considered to be data visualisation. Presentations will be 15 minutes in length with time for discussion.
Program
8:30 - 9:00 Registration
9:00 - 9:15 Opening remarks
9:15 - 10:35 Session 1
9:15 - 9:35 "Temporal Earth: framing Australian history via animated spatio-temporal data" by Matthew Coller, Temporal Earth
9:35 - 9:55 "Proportions of Bacterial Genera in 72 Stool Samples" by Jocelyn Sietsma Penington, The Walter and Eliza Hall Institute
9:55 - 10:15 "Building a clustering tree" by Luke Zappia, Murdoch Childrens Research Institute
10:15 - 10:35 "GEEmap - visualising Geelong's entrepreneurial ecosystem" by Kathy Reid
10:35 - 11:00 Morning tea
11:00 - 12:40 Session 2
11:00 - 11:20 "Visualising the Australian Transport Network" by Xavier Ho, CSIRO
11:20 - 11:40 "Consolidating biological data types to develop integrated visualisations" by Ariane Mora, Stemformatics
11:40 - 12:00 "Ungodly cocktail - visualising three editions of Raynal’s “Histoire”" by Geoff Hinchcliffe, Australian National University
12:00 - 12:20 "Interactive data visualisation in Python" by Clare Sloggett, Melbourne Bioinformatics
12:20 - 12:40 "The UTS Data Arena Virtual Machine (DAVM) and its 3D Data Cluster Pipeline." by Ben Simons, UTS Data Arena
12:40 - 1:30 Lunch
1:30 - 3:10 Session 3
1:30 - 2:30 "More than just going throught the motions: visualising creative industry research (more creatively)" by Deb Verhoeven, Deakin University (Keynote speaker)
2:30 - 2:50 "Reactive web visualisations with Python" by Ned Letcher, Forefront Analytics and The University of Melbourne
2:50 - 3:10 "CommViz: Visualising large social communication networks" by Karin Verspoor, The University of Melbourne
3:10 - 3:30 Afternoon tea
3:30 - 4:30 Session 4
3:30 - 3:50 "Fullish disclosure — Balancing completeness and salience in 2D" by Brendan Ansell, The Walter and Eliza Hall Institute
3:50 - 4:10 "Inverse Dataviz – Introducing a light-weight online tool for tracing" by Isabell Kiral-Kornek, IBM Research Australia
4:10 - 4:30 "PROVisualizer:the first high level archival data visualisation tool in Australia" by Asa Letourneau, Public Record Office Victoria
4:30 - 4:45 Closing remarks
Sponsors

The Walter and Eliza Hall Institute of Medical Research
Follow @WEHI_research

Australian Bioinformatics & Computational Biology Society
Follow @ABACBS

Linux Australia
Follow @linuxaustralia
Supporters

The Australasian Association for Digital Humanities
Follow @aaDHumanities
Contact Information
Get in touch with us at joiningthedotssymposium@gmail.com or ping us on Twitter at @FCTweedie or @rubin_af.